• Articles
  • Photography
    • American Southwest
      • American Southwest – Elite Gallery
      • American Southwest – Panoramas
      • American Southwest – Videos
    • Antelope Canyon
      • Antelope Canyon – Elite Gallery
    • Canyons
      • Canyons – Elite Gallery
      • Canyons – Panoramas
      • Canyons – Videos
    • Caribbean Cruise
    • Costa Rica
    • Czech
      • Czech – Elite Gallery
      • Czech – Panoramas
      • Czech – Videos
    • The Delaware Excursion
    • Falling Water
    • Germany
    • Halloween 2011
      • Halloween 2011 – Elite Photo Gallery
    • Halloween 2012
      • Halloween 2012 – Elite Photo Gallery
      • Halloween 2012 – Videos
    • India
      • India – Elite Gallery
      • India – Panoramas
      • India – Videos
    • Ireland
    • Maine Road Trip
    • Nashville
    • Northern Road Trip
      • Northern Road Trip – Part 1
      • Northern Road Trip – Part 2
      • Northern Road Trip – Part 3
    • Pacific Northwest
    • Rome
      • Rome – Elite Gallery
      • Rome – Panoramas
    • SoCal
    • Southeast Asia
    • Southern Road Trip
    • Western Road Trip
      • Western Road Trip – Part 1
      • Western Road Trip – Part 2
  • Tutoring
The Personal Website of Mike Specian
  • Articles
  • Photography
    • American Southwest
      • American Southwest – Elite Gallery
      • American Southwest – Panoramas
      • American Southwest – Videos
    • Antelope Canyon
      • Antelope Canyon – Elite Gallery
    • Canyons
      • Canyons – Elite Gallery
      • Canyons – Panoramas
      • Canyons – Videos
    • Caribbean Cruise
    • Costa Rica
    • Czech
      • Czech – Elite Gallery
      • Czech – Panoramas
      • Czech – Videos
    • The Delaware Excursion
    • Falling Water
    • Germany
    • Halloween 2011
      • Halloween 2011 – Elite Photo Gallery
    • Halloween 2012
      • Halloween 2012 – Elite Photo Gallery
      • Halloween 2012 – Videos
    • India
      • India – Elite Gallery
      • India – Panoramas
      • India – Videos
    • Ireland
    • Maine Road Trip
    • Nashville
    • Northern Road Trip
      • Northern Road Trip – Part 1
      • Northern Road Trip – Part 2
      • Northern Road Trip – Part 3
    • Pacific Northwest
    • Rome
      • Rome – Elite Gallery
      • Rome – Panoramas
    • SoCal
    • Southeast Asia
    • Southern Road Trip
    • Western Road Trip
      • Western Road Trip – Part 1
      • Western Road Trip – Part 2
  • Tutoring

Category Archives: Research

BuildingsClimateEnergyResearch

Energy Efficiency Can Save Lives

Mike Specian May 1, 2020 Leave a Comment 2246 Views

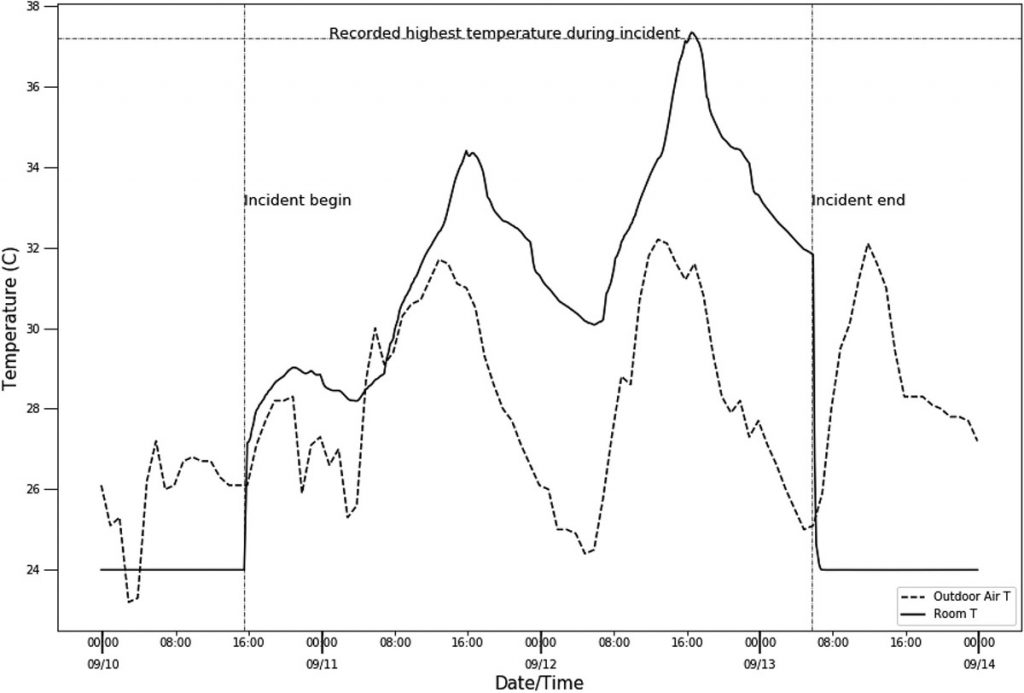
In 2017 during Hurricane Irma, a tree branch hit a transformer and knocked out the main air conditioning system for a nursing home in Hollywood, Florida. There were portable air conditioners onsite, but they proved insufficient as indoor temperatures rose to a sweltering 100°F over the course of a three-day outage. Ultimately, 12 residents tragically lost their lives to the extreme heat.

Sadly, the conditions that precipitated this disaster are all too common, and are poised to become more so. Both the number of heatwaves in American cities and their duration have been increasing for decades due to climate change. In New York City alone, extreme heat claims 120 lives annually, and 80% of those deaths occur in people’s own homes.

To examine this issue, I co-authored a study in the journal Building and Environment with Drs. Kaiyu Sun and Tianzhen Hong, researchers at Lawrence Berkeley National Laboratory. Amidst the variety of options buildings have to improve thermal survivability during heat waves, power outages, and associated events, could energy efficiency play a role in keeping occupants safe? According to our results, the answer is yes.

It is well established that energy efficient buildings can save customers money, reduce greenhouse gas emissions, improve health and well-being, and make occupants more productive. Yet the extent to which efficiency impacts our ability to adapt to, withstand, and rapidly recover from heat-related disasters – i.e., to become more resilient – has been less well studied. And many that do look at the issue largely consider only hypothetical buildings.

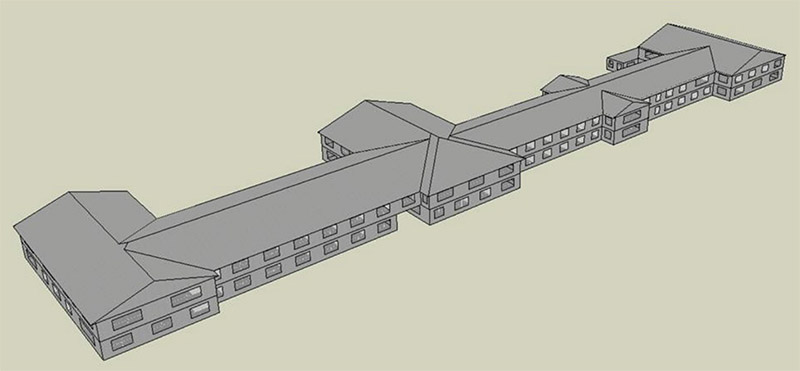
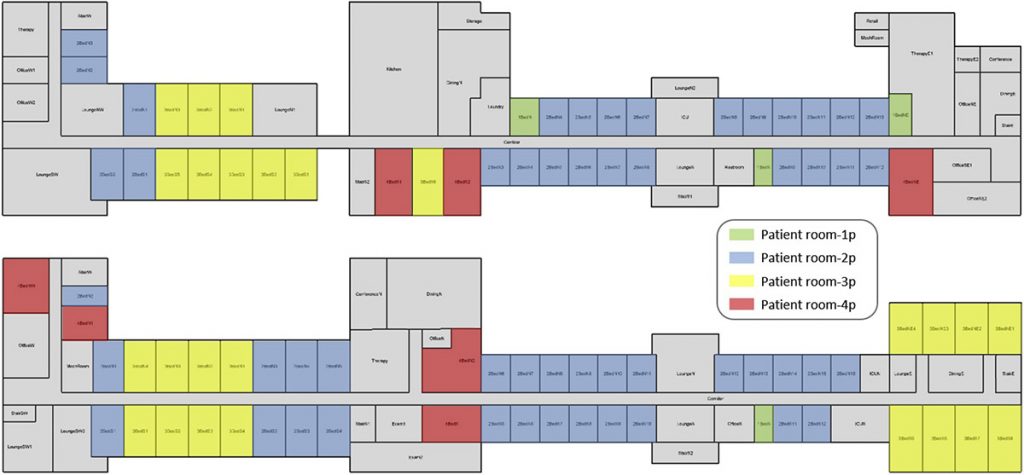
However, in the case of the Hollywood nursing home, we had a real-world example of a failed building. Weather data during the outage were available, as was a measured indoor temperature. Dr. Sun gathered the actual building data (e.g., floor plans, building components, renovation history) through publicly available records and recreated the nursing home in EnergyPlus modeling software.

3D model of the The Rehabilitation Center at Hollywood Hills

Detailed floor plans of the first (upper) and second (lower) floors. Patient rooms are colored based on the number of occupant.

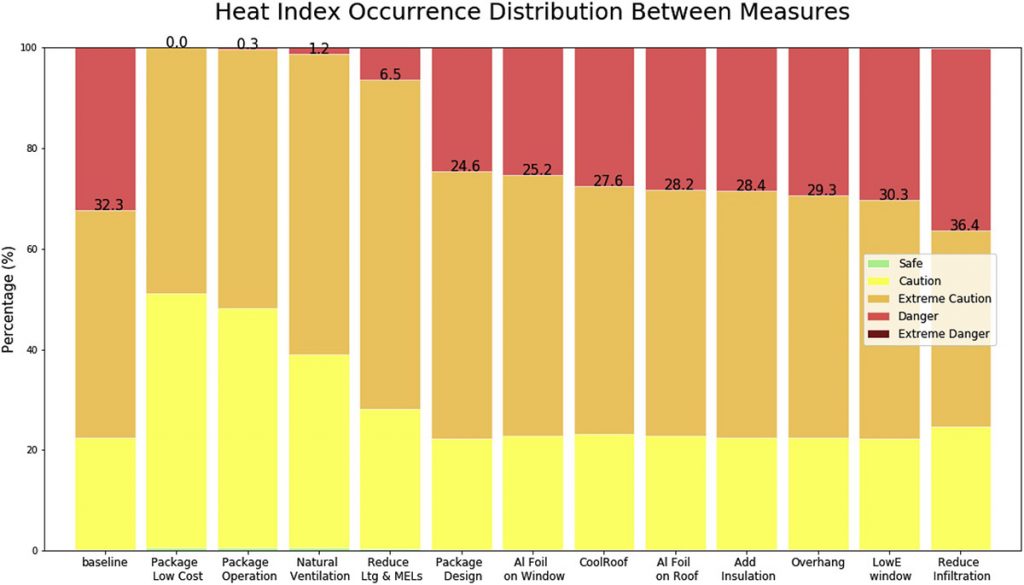
We introduced a variety of energy conservation measures like higher insulation, shielding windows and the roof with aluminum foil, applying a cool roof coating, reducing air infiltration, adding exterior shading, turning off miscellaneous electrical loads (e.g., lighting), and adding natural ventilation.

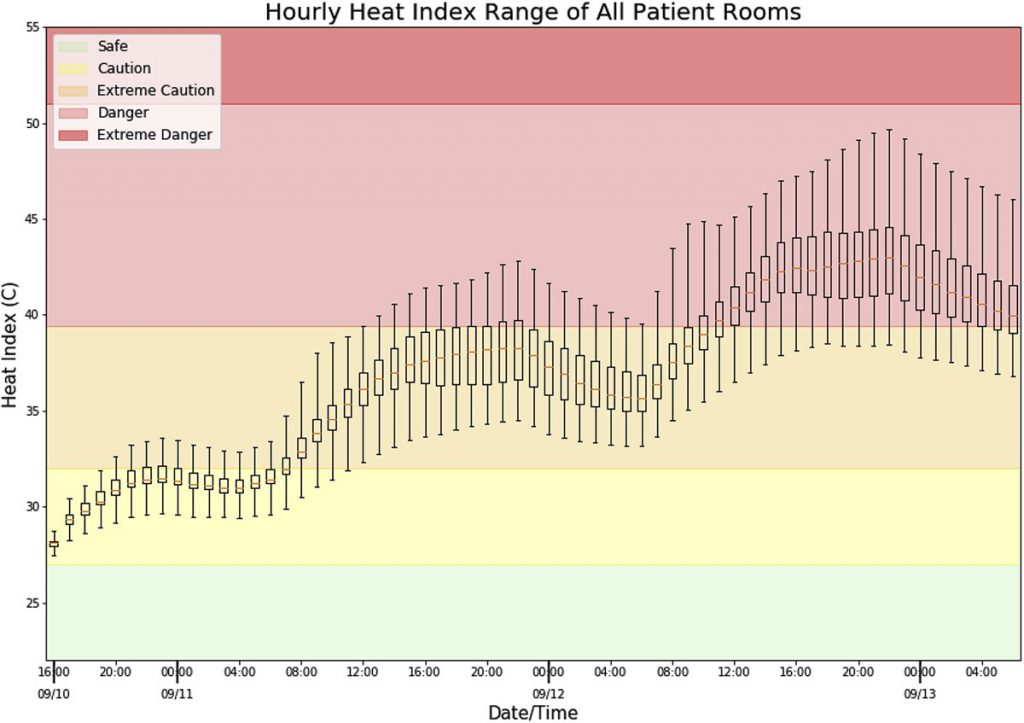
We discovered that most measures would have reduced the indoor heat index, a metric that accounts for both temperature and humidity, thereby enhancing thermal survivability. In addition, we found the most effective measure – simply opening the windows – would have cost nothing at all. However, some efficiency improvements were less beneficial than others, and one actually would have had a negative impact on resilience. Moreover, if we placed the same nursing home in a heat wave in a different city, the set of most effective measures would have changed.

Temperature comparison between one of the hottest patient rooms (solid line) and the outdoor environment (dotted line). Vertical lines represent the onset and end of the cooling outage incident.

Box plot containing the temperatures of all patient rooms over the course of the outage. Heat hazard classification is presented by the National Oceanic and Atmospheric Administration. Occupants in rooms in the “danger” zone would likely experience “heat cramps and heat exhaustion” with “heatstroke probable with continued activity”.

I’ll quote the paper itself:

Our analysis generated three high-level takeaways. First, energy efficiency is not uniformly beneficial for resilience, as different efficiency characteristics convey different resilience impacts. In particular, we found that reduced air infiltration—a staple of modern energy efficiency practices—actually made it more difficult for the nursing home to expel excess heat when indoor air temperature was higher than it was outdoors. And it would have, on its own, increased the heat index beyond the status quo. Second, the effectiveness of specific energy efficiency measures varied as a function of circumstance. By transplanting the Florida nursing home to Chicago and San Francisco during real heatwaves, we found that the value of individual measures varied as a function of multiple parameters, including climate zone, outdoor temperature, length of air conditioning outage, insolation, and local building codes. Third, the most effective efficiency measures were also the least expensive to implement. This encouraging result indicates that low-to no-cost measures could potentially be deployed in buildings in near-real time to enhance passive survivability by allowing residents to shelter-in-place.

The vertical axis represents the percentage of all room-hours with temperatures falling within each hazard classification zone. Our best estimate for what actually happened inside the nursing home is shown in the left column. The most successful individual measure, natural ventilation, reduced the percentage of room-hours in the “danger” zone from 32.3% down to 1.2%. Tightening the buidling envelope (right column) increased it to 36.4%.

I should caution that while many of these efficiency measures reduced the danger for occupants, they did not on their own make the building safe. Some additional form of energy storage was needed for that, but even 8 hours of chilled water cooling capacity would have been sufficient to keep most room-hours within the “safe” zone for the majority of the outage.

I encourage those interested in expanding the value of energy efficiency, and those eager for new pathways to enhance resilience to refer to this study. It not only demonstrates a real connection between energy efficient buildings and thermal survivability, but also that this nexus is nuanced and ripe for further exploration.

Research

Dear Citizen, Would You Like to Be a Scientist?

Mike Specian December 2, 2017 Leave a Comment 4110 Views
One of the great revolutions of the last decade is the democratization of science. Once the territory of highly trained experts, the advent of “citizen science” has opened the door of opportunity for anyone to contribute to scientific discovery. Also referred to as “crowdsourcing,” citizen science utilizes web platforms to allow people from all over the world to analyze images, report events, and even take field measurements. By tapping into the curiosity of thousands of people, conventional scientists are solving problems they (and their computers) would never have been able to alone.
 
For example, the Galaxy Zoo project asks its citizen scientists to look at images of galaxies and classify their shapes. These results can be used to train computers to do the same task automatically, thereby enhancing our understanding of galactic evolution. Snapshot Serengeti shows its citizen scientists photos taken by remote cameras in the Serengeti, then asks them to identify which animals are present. The results can be used to measure populations and migration patterns.
 
Earlier this week I was fortunate to attend a talk on citizen science led by Dr. Sophia Liu. In this article, I relate some of the top crowdsourcing resources available, then describe some of Sophia’s work in using citizen science to aid disaster recovery.
 

***

If you are going to start anywhere with citizen science, start here. SciStarter is the place to find, join, and contribute to science through more than 1600 formal and informal research projects, events, and tools. Their database of citizen science projects enables discovery, organization, and greater participation in science. Citizen scientists can track their conributions, bookmark things they like, and access the tools and instruments needed to get started. If you run a project, the site can help you grow and manage your volunteers.

Citizenscience.gov is an official government website designed to accelerate the use of crowdsourcing and citizen science across the U.S. government. The site provides a portal to three key assets for federal practitioners: a searchable catalog of federally supported citizen science projects, a toolkit to assist with designing and maintaining projects, and a gateway to a federal community of practice to share best practices.

One of my personal favorite projects is OpenStreetMap. OpenStreetMap (OSM) is an open data platform for mapping things that are both real and current. It includes millions of buildings, roads, trails, cafes, railway stations, parks, and more along with details about those places. You can map whatever real-world features are interesting to you! Built by a community of mappers, OSM emphasizes local knowledge drawn from a diverse community of enthusiasts, GIS professionals, and engineers who gather information using aerial imagery, GPS devices, low-tech field maps, and more. (While not strictly crowdsourcing, I can’t help but mention the project what3words, which has divided the entire world into 3m x 3m squares and assigned each a unique 3 word address.)

Zooniverse is a citizen science web portal owned and operated by the Citizen Science Alliance. It is home to some of the internet’s largest, most popular and most successful citizen science projects. The organization grew from the original Galaxy Zoo project and now hosts dozens of projects which allow volunteers to participate in crowdsourced scientific research. Projects have been drawn from disciplines including astronomy, ecology, cell biology, humanities, and climate science. It offers a feature to “build a project.”

Crowdcrafting is a web-based service that invites volunteers to contribute to scientific projects developed by citizens, professionals, or institutions that need help to solve problems, analyze data, or complete challenging tasks that can’t be done by machines alone and require human intelligence. The platform is 100% open source and 100% open-science, making scientific research accessible to everyone.

CitSci.org can support your research by providing tools and resources that allow you to customize your scientific procedure – all in one location on the Internet. CitSci.org provides tools for the entire research process including: creating new projects, managing project members, building custom data sheets, analyzing collected data, and gathering participant feedback. It can be a useful platform to gather and analyze crowdsourced data.

And just for a bit of local flavor, Washington DC has Project Sidewalk, which uses crowdsourced image analysis to identify problems with city sidewalks.

***

Dr. Sophia Liu is an Innovation Specialist at the U.S. Geological Survey Science and Decisions Center. Sophia has done all sorts of cool work. She is the Co-Chair of the Federal Community of Practice for Crowdsourcing and Citizen Ccience (CCS) and the CCS Coordinator for the United States Geological Survey (USGS) and the Department of Interior. She has worked at the USGS National Earthquake Information Center, the St. Petersburg Coastal Marine Science Center, and the Energy, Minerals, and Environmental Health Programs at the National Center in Virginia.

Most recently Sophia was assigned to the Federal Emergency Management Agency (FEMA) to response to the 2017 hurricanes. She introduced us to a number of crowdsourced maps that were and are being used in Puerto Rico’s recovery effort. One map developed for FEMA by volunteers shows Puerto Rico’s road and hospital status in the aftermath of Hurricane Maria. Another map shows locations on the island where bridges are out, power is available (or not), cell service is present, food or potable water are available, etc. In the hurricane’s immediate wake, Story Map Series provided an overview of available geospatial information from both government provided sources and crowdsourced data.

Sophia also worked on several USGS projects. One of them was Did You Feel It? (DYFI), which collects information from people who felt an earthquake and creates maps that show what people experienced and the extent of damage. Users answer easy questions about observable phenomena so that community intensity maps can be created, then integrated into other products.

She also worked on Tweet Earthquake Dispatch (TED), a project that maps people’s tweets about earthquakes. These tweets actually made detections faster than automated systems 90% of the time. They were also able to identify earthquakes that were not detected seismically.

Another project she worked on is called iCoast. Although aerial photos are often available before and after storms, researchers and responders are not always able to do much with them. Using citizen science, iCoast asks people to compare photos of coasts before and after events. The results are used for Bayesian predictions of coastal damage.

Sophia and her team at FEMA have worked with a number of volunteer network groups whose members are motivated by knowing that their efforts are leaving a positive impact. She helped FEMA recognize the value of these existing organizations and their established workflows. She and her team adapted to meet the volunteers on the platforms that they used, like Google and Slack. Sometimes hackathons are held to operationalize crowdsourcing for emergency management. Some of that material is available on GitHub.

More can be done to improve this process. To leverage crowdsourcing to better respond to hazards, Sophia recommends making hazard models more open and accessible to the tech crowds that can integrate them with other baseline data and post-storm data sets. Online visualization viewers could be improved. Independent platforms should be developed, and post-storm evaluations should be more immediate. Ultimately she thinks we can combine all of this together to create an improved playbook for emergency management.


Featured image: “Citizen Science volunteer” by Mount Rainier National Park is licensed under CC BY 2.0 / image has been cropped and foliage added

AstrophysicsClimatePoliticsResearch

10 Ways You Can Be a Better Advocate for Science

Mike Specian April 20, 2017 Leave a Comment 3852 Views

This Saturday, marches in support of science will be held in hundreds of cities across the globe. The event should be an excellent opportunity to reinject science back into the public consciousness.

The American Association for the Advancement of Science (AAAS), the world’s largest general scientific society, held an event on April 19 offering advice on how to advocate for science beyond the march. Here I share some of their strategies for interacting with Congress, the media, and the public.


CONGRESS

Despite what many people think, citizens can influence Congress. In fact, a survey of those in positions of authority within Congressional offices reported that when their representative has not already arrived at a firm decision on an issue, contact from a constituent is about five times more persuasive than from a lobbyist.

Being influential, however, is about more than just being right. Congressional offices receive roughly 250 requests per day, so there are a few things you can do to stand out in an office that is essentially a triage unit.

  • Ask for something concrete your representative can realistically deliver on.
  • Explain why it is urgent.
  • Make your pitch concise (< 10 minutes) and develop a one-page handout to leave after the meeting. Keep politics out of it!
  • Be engaging! Tell a real story, preferably about someone who has one foot in your world, and one foot in your representative’s.

While your initial contacts with an office may be met with no response, be persistent. You can get that meeting!

MEDIA

Scientists are considered the most trustworthy spokespersons for science. But communicating effectively with the media requires that you do your homework and know your audience (e.g. business, technical, students).

You will want to have a well-honed, practiced elevator pitch. It should succinctly lay out the research problem, why it matters, and what the take home message is (i.e. what you can say that will lead to a longer conversation). You can always bridge back to it if you get questions you are not ready for, or if the interview otherwise is not going smoothly. Ask the reporter how they plan to frame the article. Use that as an opportunity to correct any inaccuracies.

It’s advantageous to build personal relationships with journalists. Inviting them to visit your laboratory, sending them relevant background information, connecting on social media, and just generally being cordial can help you become a trusted and go-to source.

PUBLIC

Perhaps the most important question to ask yourself when communicating science to the public is, “Why am I doing this?” Perhaps it is to increase interest in science, or to share knowledge. Maybe you want to inspire the next generation to enter the discipline, or increase trust between scientists and the public.

Once you are clear about your purpose, abide by these tenets:

  • Don’t “dumb down” your science or treat your audience like idiots. Disdain is an ineffective communication technique.
  • Ditch the jargon. For example, the public has a different understanding of the phrase “positive feedback” than scientists do. Instead use something more clearly understood, like “vicious cycle.”
  • Create a dialogue so that you know where your audience is at. Let them know they are being heard.
  • Reverse the order of a scientific talk. Start with the conclusions, explain why the issue matters, then finish with the background details.

IN CONCLUSION

Be enthusiastic! Put your own face on science and demonstrate what keeps you motivated. Offer solutions, and sidestep landmines (e.g. focus on clean energy with someone who thinks climate change is a hoax).

Doing all of this on your own can be daunting and time consuming. Know the resources to make your life easier. Contact your university, institute, or relevant scientific society to collect their outreach materials. Find groups in your local community that you can partner with, like those who are already gathering an audience and where you might be permitted to speak.

There are many other available resources. Research!America holds science communication workshops that train people to better communicate medical research. Spectrum Science Communications helps “develop unique stories that create game-changing conversations to influence audiences and differentiate your brand.” AAAS is launching an advocacy toolkit, and many disciplinary organizations, like the Society for Neuroscience and American Physical Society have their own resources.

Research

Techniques for Organizing, Curating, and Presenting Content on the Web

Mike Specian November 20, 2015 Leave a Comment 5405 Views

We live in a golden age of online research and communication. The number ways to obtain information, many of which I covered last week, is staggering. Of course, simply having information is not enough. We must also be able to effectively organize, synthesize, and present our findings.

For years, I used an almost embarassingly rudimentary tool for storing references – Microsoft Word. I would read an article, catagorize its content, summarize it, and provide a link in my document. This level of organization can be sufficient, but I found it less than ideal for several reasons. My work remained at a standstill until I could return to my computer and access Word. There was no way to peer into the articles without clicking on the links. All sorting had to be done by hand.

I researched several web-based alternatives and one service rose to the top – Diigo. With just a couple clicks, the Diigo browser applet can save an article to your personal online library. In addition, you can add your own summary, highlight sections that interest you, and attach comments. You have the option to tag your article manually or accept Diigo’s intelligent recommendations.

Unfortunately, the Diigo mobile app is buggy. For storing and reading articles on the go, I like Pocket. While alternatives like Readability and Instapaper are certainly adequate, I prefer Pocket’s clean interface and stable design. Like Diigo, Pocket allows article tagging. Reposting to Facebook, Twitter, Evernote, Reddit, etc. is a breeze.

Because Pocket is better at logging and reading articles, while Diigo is better at annotating and sorting them, I bridge the two using a very cool application called If This Then That (IFTTT). Using a collection of simple “if this, then that” commands, you can create your own mobile recipes. For instance, you can command IFTTT to send you an email if your weather app says it is going to rain, or store results to a spreadsheet if certain items on Craig’s List go up for sale. My IFTTT recipe says that if I use the tag “diigo” on an article in Pocket, it will automatically appear in my Diigo library! For me, it’s a nice way to separate the “article search” and “deep research” aspects of the problem when I’m on the go.

If you are working with a group, there are a number of great options to help keep your content organized. One popular tool – if you’re willing to shell out a little coin – is Evernote. With Evernote, you and your collegues can create “notes,” which function a lot like Word documents.

Imagine attending a conference where interesting talks are happening simultaneously. Using Evernote, team members can attend different talks, summarize each in its own note, then tag and organize them into one or more “notebooks.” These can be shared privately with members of your network, quasi-publically with anyone possessing a generated link, or publically through social media sites. Evernote can also capture web articles, photos, handwritten notes, and offers attractive presentation capabilities.

If you’ve advanced to the task delegation stage, you may want to try BaseCamp. This service allows you to make to-do lists and assign who takes care of which item. Events and deadlines can be automatically linked to your personal calendar. BaseCamp also acts as a meeting point. It provides space to work collectively on documents. You can also schedule regular check-ins on topics of your choosing, like “What interesting things have you read in the last week?”

If you work within an organization, you may be able to disseminate your content through its blog, newsletter, website, or media team. For the less well-connected, you might try a personal blogging service like Tumblr, or one of the many image sharing sites like Pinterest. If you desire more control but don’t want to construct a website from scratch (like me), then creating a site through WordPress might be just the thing. Once you purchase your domain name and server space (from companies like BlueHost, pair Networks, etc.), all you have to do is install WordPress, select a theme, and customize using a large network of plug-in’s. One of the most useful is Yoast SEO, which optimizes your site for search engines.

Readership matters, and your content is more likely to be read if it contains images or videos. If you are unwilling to create your own, you can purchase some from sites like iStock and Shutterstock.

However, my preference is to avoid paying for images. The absolute best way to do this is through a copyright management system known as the Creative Commons (CC). People who are willing to let their images be used for free can assign to them a CC license that specifies how they may be used. You can then use Creative Commons Search to locate free images, music, and videos to incorporate into your own content.1You may notice that most of my banner images are taken from the Creative Commons and cited accordingly.

The popular photo sharing site Flickr has hundreds of millions of photos available under the Creative Commons. Pixabay has about a half million, but all can be used freely even for commercial applications. Personally, I have found it more efficient to search for images through Compfight, a web engine based off the Flickr API. In addtion to searching over the usual fields like keyword and text, Compfight also filters based on license, often the most useful field when assembling web content.

If all of this sounds like too much work and you’re willing to pay a monthly fee, you can try a service like Scoop.it, which uses a “selection engine” to scour the web for subject matter of your choosing. The real benefit of this service is that it curates your content for you, though you retain the ability to add information and edit the overall presentation. Once your content is conveniently organized, you can post it to all of your social media sites.

So in conclusion, these are some of the tools I prefer when organizing and presenting content on the web. No doubt I have missed many excellent alternatives, so if you have your own favorites, I invite you to share!


Featured image: “tech worker” by Wrote, used under CC BY-NC 2.0 / bottom of image has been cropped from original

Notes[+]

Notes
↑1 You may notice that most of my banner images are taken from the Creative Commons and cited accordingly.
ClimateEnergyResearch

Supercharge Your Internet Research with These Essential Tips

Mike Specian November 9, 2015 Leave a Comment 5002 Views

Several years ago I found myself in a room with people on the forefront of the climate movement. Among their ranks were journalists, advocates, and members of nonprofit organizations. These science communicators had gathered to address an issue each of them had been grappling with – how do I find all of the information that I need and communicate it with the people that need to hear it?

The questions seemed so fundamental that I had assumed everyone in attendance already knew the answers. I didn’t, of course, because I was the outsider. As an astrophysicist, research for me is relatively straightforward. There are a limited set of journals that cover our field and a convenient web interface, NASA’s Astrophysics Data System (ADS), to search across their articles.1Friends in other fields have sung the praises of similar programs like EndNote and Mendeley.  The program not only links users to all references in an article’s bibliography, but also reports which papers ended up citing that article. Smart engines could even recommend other papers to read based on your selections.

I have found tracking down information online in the realm of climate/energy policy to be more difficult. There are many more organizations doing independent research or running their own initiatives. Think tanks, NGOs, and government agencies are more likely to publish and promote on their own websites than through peer-reviewed journals. The impacts of climate change are so vast that they cut across traditional academic disciplines. They influence weather, oceans, atmospheres, ecosystems, human health, urban development, energy systems, breakthrough technologies, and many more.

When information is so widely dispersed, and we lack smart engines to find them automatically for us, what should our information collection strategy be? I don’t profess to have the “right answer” to this problem, should one even exist. But I’ve spent enough time gathering suggestions from others and trying them out for myself that I felt compelled to report some of the strategies and sources that have worked for me.

Before I begin, I want to comment that you can’t put everything together overnight. I’ve found that so much of the process is just keeping your ear to the ground. When an article I’m reading references an organization with which I’m unfamiliar, I jot it down. I visit their website, make a note about their mission and, if they have them, subscribe to their newsletter and Twitter feeds. I use Twitter lists to tag the feeds and keep them organized.

A great first source for content is Google, which offers among the best suite of tools for aggregating real-time news. Through Google News, you can personalize your news feed to return only the topics and regions you are interested in. The service allows you to specify whether you want content rarely, occasionally, sometimes, often, or always. Google Alerts goes a step further and contacts you when new information becomes available. Many news outlets offer the same capability.

If you are having difficulty deciding what’s important in the moment, the very cool newsmap may be the tool for you. Powered by Google’s search engine, newsmap visualizes the news by separating it into color-coded categories like World, National, Business, Technology, Sports, Entertainment, and Health. The color saturation reflects how old the story is, while the size shows how much it is being reported online. As with Google, you can filter by country and newsource. It’s a handy way to ascertain what’s hot right now.

Over time, or perhaps through a mentor, you may discover that your field has its own news/reference engines. Lawyers gather their research through the library database LexisNexis. Climate and energy folks have the Global Reference on the Environment, Energy, and Natural Resources (GREENR). Environment & Energy Publishing reports all the top developments. The news and analysis website Responding to Climate Change (RTCC) provides the latest news regarding low carbon developments.

Another great way to be exposed to new content is through Flipboard2and Zite, which it recently acquired. After signing up, Flipboard presents you with an absurd number of topics to choose from. They range from the conventional (e.g. religion, technology, art) to the more specific (e.g. industrial design, startups, social justice). You select the topics that interest you and Flipboard scours the web to produce a curated magazine readable on most devices. You can also stumble upon new content using, well, StumbleUpon. It has the same idea, but rather than curating material, it randomly deposits you at relevant webpages until you press a button to “stumble” to the next one.  I have found a lot of really excellent content through this service.

Because the combined readership of an article or report is likely to possess more cumulative knowledge than the authors themselves, one should never discount the value of user comments. Sites like the New York Times and Ars Technica have great comment engines where user contributions can be elevated to “reader’s picks” or “editor’s picks”. It’s a great way to sample the wisdom of the masses and be exposed to a much broader perspective.

It literally took me years to assemble the repository of references I now possess. In the world of climate and energy policy, I found that information typically arrives in one of three forms – organizational reports, raw or lightly processed data, and independent projects.

Organizational reports are usually published by issue-focused research groups. For climate and energy, there are way more than I could name here. These include the National Academy of Sciences, the United States Global Change Research Program, the Union of Concerned Scientists, the Information Technology and Innovation Foundation, Brookings, Energy Innovation, and many more.

Two of my personal favorites are the George Mason University Center for Climate Change Communication (4C) and the Yale Project on Climate Change Communication.  These academic centers were created to conduct unbiased social science research on how people engage with climate change. They discovered that people are more concerned about “global warming” than “climate change.”  They reported what weathercasters think about climate change and its impact on weather, and questioned whether the level of sciencific consensus on climate change ought to be communicated numerically or non-numerically.

The second form information arrives in is raw or processed datasets. Government agencies like NASA and the National Oceanic and Atmospheric Administration (NOAA) are great resources here, as they have tons of images, datasets, and visualization tools that let you tell your own story from primary sources. The U.S. Energy Information Administration (EIA) and International Energy Agency (IEA) also offer tons of data to play around with.

Some groups are content to curate data in very specific ways. The Database of State Incentives for Renewables and Efficiency (DSIRE) categorizes state policies that promote renewable energy as either financial incentives or rules and regulations. Frack Track provides a self-described “geospatial policy tool” that analyzes and visualizes Pennsylvania’s new wave of gas development on the Marcellus shale. Wells, permitted sites, and locations of violations are provided on a map.

The third form is independent projects, a term that I’m admittedly using as something of a catchall. These include initiatives that aim to tell the story of climate change in unique ways. For example, for their project Atlantic Rising three friends started a journey to travel the 1-meter above sea level contour line to see what life would be like in a flooded world. They interacted with thousands of people in 22 countries gathering photos, film, and writings as they documented the changing lives of those along the rim.

Photographer John Weller believes the best way to protect the environment is by reminding people of nature’s visceral beauty. He spent a decade traveling to the rough waters of the Ross Sea, probably the last, undamaged ocean ecosystem left on earth. His stunning photographs of the region’s living creatures, both above and below the water, have been cataloged in the book The Last Ocean.

Finally, it is sometimes most useful to just speak to people personally. While conferences can be a great place to do this, these environments can be intimidating for newcomers to a field. There are some tricks you can employ to make this process go more smoothly, but I will reserve them for a future post.

Of course, simply having information is not enough. You must synthesize and deliver it to your audience in an effective way. This raises a whole new set of challenges that I will get into in my next post.


Featured image: “tech worker” by Wrote, used under CC BY-NC 2.0 / bottom of image has been cropped from original

Notes[+]

Notes
↑1 Friends in other fields have sung the praises of similar programs like EndNote and Mendeley.
↑2 and Zite, which it recently acquired

About Me

mike_specian

Hi, I’m Mike Specian. This site is a repository for things that matter to me including science, energy, climate, public policy, and photography from around the world. You are welcome to follow me on social media or by subscribing to email updates below.

Subscribe

Sign up for email updates when new content is posted.

Follow me on social media

Gallery

Morraine-Lakes-Hills-and-Boats-edits Moss-Covered-Mailbox-edit Mt-Robson-Moon-Behind-Glacier-Version-1 Plitvice-Lakes-Middle Cathedral-Lake-Stars-over-Lake Cathedral-Lake-Sunset-with-Tree Knoblock-Transparent-Milky-Way Moonrise-over-the-Indian-Ocean Driftwood-and-Boat leon-viejo-memorial-a-los-fundadores-espanoles-de-leon-santiago-de-los-caballeros ometepe-michaels-strip-of-land-looking-towards-concepcion ometepe-island-panorama-with-concepcion-and-partial-maderas-in-background

Most Recent Posts

  • I visited Iceland and Paris in 2010. I’m finally ready to share what happened.
  • Energy Efficiency Can Save Lives
  • An Interview with FERC Chairman Neil Chatterjee
  • What To Prioritize – Retrofits or New Construction?
  • Buildings – A New Hope to Solve Climate Change

Categories

  • Astrophysics
  • Buildings
  • Climate
  • Energy
  • Personal
  • Photography
  • Politics
  • Pro Wrestling
  • Research
  • Travel
  • Video Games
© Copyright 2014. Theme by BloomPixel.